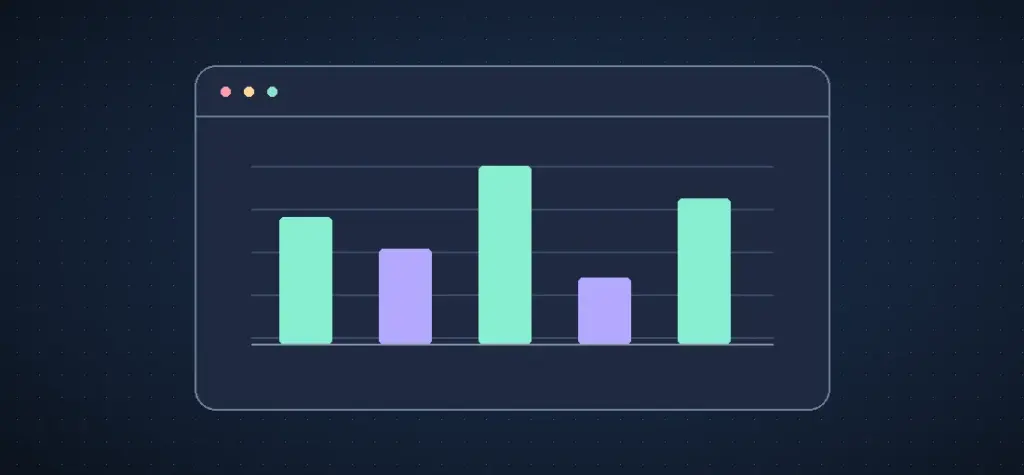
A browser chart is useful inside a dashboard. A scheduled report usually needs something simpler to deliver, such as a fixed PNG that opens in an email or can be placed in a PDF. Give the renderer a small, verified dataset and run the same rendering process each time the report is built.
What the original article solved
At this address, Ashley Davis used C3 for charts and Nightmare to run a browser. The two parts did different jobs. The chart library converted numbers into a picture and the browser captured it for later use. The example below takes the same approach with Canvas and Playwright screenshots. A chart library can replace Canvas when you need axes, legends and more than one series.
Render one local chart
Install Playwright and its Chromium browser in your project with npm install playwright and npx playwright install chromium. Save the example as render.mjs and run node render.mjs. The values below are sample ticket counts and the labels are weekday names. The scale starts at zero because the display uses bars.
import { chromium } from 'playwright';

const records = [
  { label: 'Mon', count: 42 },
  { label: 'Tue', count: 35 },
  { label: 'Wed', count: 47 },
  { label: 'Thu', count: 18 },
  { label: 'Fri', count: 32 },
];

const browser = await chromium.launch();
try {
  const page = await browser.newPage({ viewport: { width: 640, height: 340 } });
  await page.setContent('<body style="margin:0"><canvas width="640" height="340"></canvas></body>');
  await page.evaluate(data => {
    const canvas = document.querySelector('canvas');
    const ctx = canvas.getContext('2d');
    const floor = 270;
    ctx.fillStyle = '#131d2a';
    ctx.fillRect(0, 0, canvas.width, canvas.height);
    ctx.font = '18px sans-serif';
    ctx.fillStyle = '#edf8f4';
    ctx.fillText('Support tickets by weekday', 36, 42);
    const maximum = Math.max(1, ...data.map(row => row.count));

    data.forEach(({ label, count }, index) => {
      const x = 60 + index * 106;
      const height = (count / maximum) * 164;
      ctx.fillStyle = '#84edca';
      ctx.fillRect(x, floor - height, 57, height);
      ctx.fillStyle = '#edf8f4';
      ctx.fillText(String(count), x, floor - height - 10);
      ctx.fillText(label, x, floor + 28);
    });
  }, records);
  await page.locator('canvas').screenshot({ path: 'support-tickets.png' });
} finally {
  await browser.close();
}
The drawing finishes inside page.evaluate() before the screenshot. For a chart library that loads fonts or animates a series, add an explicit readiness check and wait for the final state before capturing it. A fixed timeout captures an arbitrary point in that sequence.
Make repeated outputs comparable
The example scales to the largest count in its own dataset. For pictures placed side by side in a weekly report, use the same agreed ceiling on both charts where the goal is comparison. Otherwise a shorter week can still produce a full-height bar. Reject negative or invalid counts before rendering, and label the period and metric in the report.
Store the numbers that produced each image. They provide an accessible alternative to the picture and help you explain changes when someone reads an earlier report. Then pin your browser and library versions in the build environment if you need stable output across machines.
Sources include the original article in Ashley Davis’s archive, Playwright’s screenshot documentation and the Canvas API reference.