The simplest possible starting point for scalable logging on your Kubernetes cluster
So you’re the proud new owner of a Kubernetes cluster and you have some microservices deployed to it. Now, if only you knew what the heck they were all doing.
Implementing log aggregation is an imperative in the world of microservices. Things can get out of hand quickly — as our application grows, it’s easy to become overwhelmed trying to figure out what’s going on.
You’ve probably read other blog posts on this subject. They are usually about Fluentd and Elasticsearch. That seems to be the default solution, but the setup is usually overly complicated and difficult.
What if you want to understand what’s going on under the hood? Good luck with that. What if you’d prefer a light-weight solution? Try again.
In this blog post, we’ll explore what it takes to build your own Kubernetes log aggregator. We’ll look at an example Node.js microservice called Loggy that is designed to forward logs from Kubernetes to an external log collector. This won’t be enterprise-ready, but there’s no reason we can’t achieve that later. For the moment, we’ll focus on building something that’s suitable for a small application (possibly an MVP) and along the way we’ll learn about Kubernetes logging architecture and DaemonSets.
Logging architecture
How does logging work in Kubernetes?
Figure 1 gives you a graphical depiction.
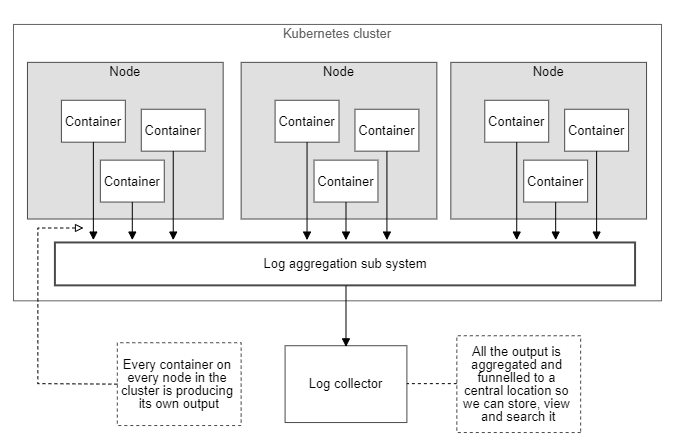
Figure 1: A conceptual log aggregation system on Kubernetes
We have a Kubernetes cluster with multiple nodes. Each node runs multiple containers (themselves each contained within a Pod). Our microservices application is composed of all the containers across the whole cluster. Each container produces its own output, which is automatically collected by Kubernetes and stored on the node.
We need a log aggregation system to merge these log files and forward the output to an external log collector. We can implement such a system on Kubernetes using a DaemonSet. This is how we’ll run our Loggy microservice on every node and from there give it access to the node’s accumulated log files.
Figure 2 shows how the output from each container is collected to separate log files that are then picked up by Loggy:
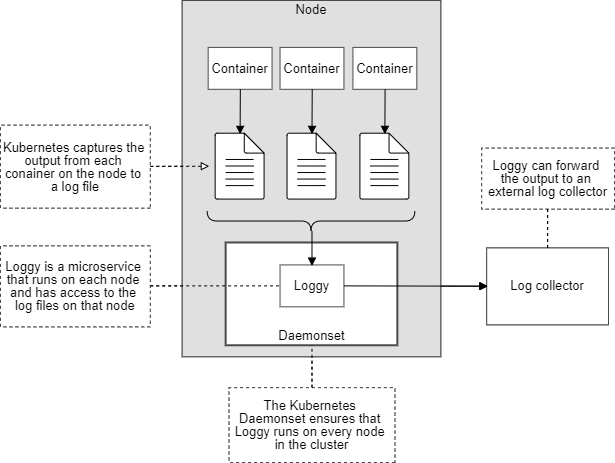
Figure 2: Our log aggregator microservice (Loggy) can access the logs from every container running on the node
Getting the example code
Example code for this blog post is available on GitHub at https://github.com/ashleydavis/kubernetes-log-aggregation-example.
The example code is designed for you to replicate the results in this blog post.
To follow along you’ll need:
- A Kubernetes cluster to experiment on (preferably not your company’s production cluster).
- A Linux-style terminal to run commands from:
- I use Ubuntu Linux,
- MacOS should work, or
- Git Bash on Windows
- Docker installed so you are ready to build and push images.
- Kubectl installed and authenticated so you are ready to interact with your cluster.
Basic logging
If you have not already tried the more basic approaches to logging with Kubernetes, you should try them first before delving into more advanced log aggregation.
If you are already setup to use the Kubernetes dashboard, that’s probably the simplest way to view recent logs from any pod.
Otherwise, use the kubectl logs command to pull logging from any pod:
kubectl logs <pod-name>These basic approaches are a good starting point. You can get a lot of mileage with them in the early days of building your application on Kubernetes.
Sooner or later, though, you’ll want to aggregate your logs into a single place where it’s easy to view and search them.
Something to log
Before we can experiment with log aggregation, we need to have a container running and generating output.
Listing 1 is a YAML file that deploys a counter pod to Kubernetes. This creates a container that generates a continuous stream of output.
apiVersion: v1
    kind: Pod
    metadata:
    name: counter
    spec:
    containers:
    - name: count
        image: busybox
        args: [/bin/sh, -c,
                'i=0; while true; do echo "$i: $(date)"; i=$((i+1)); sleep 1; done']
Listing 1: YAML for a Kubernetes counter pod to generate output
Deploy the counter pod to Kubernetes with the following command:
kubectl apply -f ./scripts/kubernetes/counter.yamlGive the counter pod a few moments to start and then check that it’s generating output:
kubectl logs counterYou should see a continuing sequence of output from the counter pod.
Exploring Kubernetes log files
Now let’s create a test pod that we’ll use to explore the log files collected on a node.
Listing 2 is a YAML file that deploys our new pod as Kubernetes DaemonSet so that the pod runs on every node in the cluster. We’ll use this to get access to the log files.
apiVersion: extensions/v1beta1
    kind: DaemonSet
    metadata:
    name: test
    namespace: kube-system
    labels:
        test: test
    spec:
    template:
        metadata:
        labels:
            test: test
        spec:
        serviceAccountName: test
        containers:
        - name: test
            image: ubuntu:18.04
            args: [/bin/sh, -c, 'sleep infinity']
            volumeMounts:
            - name: varlog
            mountPath: /var/log
            - name: varlibdockercontainers
            mountPath: /var/lib/docker/containers
        volumes:
        - name: varlog
            hostPath:
            path: /var/log
        - name: varlibdockercontainers
            hostPath:
            path: /var/lib/docker/containers
Listing 2: YAML for a Kubernetes testDaemonSet to explore log files on a node:
In Listing 2, we’re simply starting an Ubuntu Linux container and using the command sleep infinity to make the container run forever (doing nothing).
Note how the directories /var/log and /var/lib/docker/containers are mounted into the test pod. This is what gives us access to the directories containing the log files.
Deploy the DaemonSet to the cluster with this command:
kubectl apply -f ./scripts/kubernetes/test-run.yamlGive it a few moments to start and we’ll have the test pod running on each node in our cluster. Run the get pods command to list the pods:
kubectl --namespace kube-system get podsWe are only listing pods from the kube-system namespace, which is where we deployed the new DaemonSet. In the list you should see the test pods.
There should be one pod running for each node in your cluster. If you have three nodes, you’ll see three of these test pods.
Pick the first test pod and run a shell in it like this:
kubectl --namespace kube-system exec -it test-4hft2 -- /bin/bashJust be sure to replace test-4hft2 with whatever the name of your pod actually is. That is the generated name for the pod and it will be different in your cluster. This opens a command line shell in your container so you can issue commands to it.
Let’s use this to explore the log files.
Change directory to the mounted volume that contains the log files:
cd /var/log/containersNow view the content of the directory:
lsYou should see a bunch of log files here. Find the log file for the counter pod. If you don’t see it, it probably means you are connected to the wrong test pod.
Because it’s a DaemonSet, you have one of these running on each node in your cluster and you might have connected to one that’s running on the wrong node. If that’s the case, try connecting to the other test pods in turn until you find the one that has the counter pod’s log file.
Print the content of the counter pod’s log file like this:
cat counter_default_count-7a6a001c407ef818ea85f28685b829f51512d70b18a4bf01f.logYou’ll need to replace the name of the log file with the name that you actually see in your container, because the unique ID it generates will be different for your cluster than it is for mine.
The content of the counter pod’s log file will look something like this:
{"log":"0: Sun Dec  1 03:33:17 UTC 2019\n","stream":"stdout","time":"2019-12-01T03:33:17.223963224Z"}
{"log":"1: Sun Dec  1 03:33:18 UTC 2019\n","stream":"stdout","time":"2019-12-01T03:33:18.224897474Z"}
{"log":"2: Sun Dec  1 03:33:19 UTC 2019\n","stream":"stdout","time":"2019-12-01T03:33:19.225738311Z"}
{"log":"3: Sun Dec  1 03:33:20 UTC 2019\n","stream":"stdout","time":"2019-12-01T03:33:20.226719734Z"}
You can see immediately that each line of the log file is a JSON object. Scanning the structure of this log file gives us some clues on how we should go about parsing it.
When you are done exploring the log files in your test pod, delete the DaemonSet like this:
kubectl delete -f ./scripts/kubernetes/test-run.yamlTackling log aggregation
Before we can really tackle log aggregation, we have a bunch of questions we must answer.
How will we find the log files?
Globby is a great npm package for finding files based on globs.
We’ll use the following glob to find all the log files on each node:
/var/log/containers/*.logHow will we eliminate system log files?
The log file directories on any given node contain logs not just for our application but also for all the pods that make up the Kubernetes system.
We usually just care about output from our application, so we need a way to exclude the system log files (including the Loggy microservice itself).
Fortunately, we can also do this with Globby by using a glob to exclude the system log files:
!/var/log/containers/*kube-system*.logThe exclamation mark says that we’d like to exclude log files that match that pattern.
Putting both our globs together gives us a specification that identifies the log files of interest:
/var/log/containers/*.log
!/var/log/containers/*kube-system*.log
How will we track a log file?
As a log file is updated we’d like to be notified of the new output.To do this, we’ll use the node-tail npm package.
There’s actually a bunch of options for this kind of thing, but I’ve gone with the one that has the most stars on GitHub.
How will we be notified of new log files as they are created?
As new pods are deployed to the cluster, new log files are created.
We need to be watching the file system to know when new log files become available to be tracked.
To do this, we’ll be using the npm module chokidar.
Again, there’s other options for this kind of thing, but I’ve used chokidar before and am happy to use it again.
How will we parse the log file?
This part is easy. We already determined that each line in the log file is a JSON object.
We’ll be using the node-tail library to receive new lines as they come. We’ll parse each incoming line of output with the builtin JavaScript function JSON.parse.
Where will we send each log entry?
This part is entirely up to you and depends on where you want to store your logs.
You could store the logs in a database in your cluster, but that’s not a great idea — if you have problems with your cluster, you may not be able to retrieve the logs to diagnose the issue.
It’s best to forward your logs to an external log collector. A good way to do that is sending batches of logs by HTTP POST request. In this blog post, we’ll only go as far as printing out the logs as they arrive in Loggy.
Loggy: possibly the world’s simplest log aggregator for Kubernetes
This brings us to Loggy, possibly the simplest and smallest log aggregation microservice for Kubernetes.
Listing 3 shows the full code for Loggy.
Read through it and notice the following:
- globby identifies the log files;
- tail tracks each log file for new output; and
- chokidar watches for new log files.
const tail = require("tail");
const globby = require("globby");
const chokidar = require("chokidar");

//
// The directory on the node containing log files.
//
const LOG_FILES_DIRECTORY = "/var/log/containers";

//
// A glob that identifies the log files we'd like to track.
//
const LOG_FILES_GLOB = [
    // Track all log files in the log files diretory.
    `${LOG_FILES_DIRECTORY}/*.log`,

    // Except... don't track logs for Kubernetes system pods.
    `!${LOG_FILES_DIRECTORY}/*kube-system*.log`,
];

//
// Map of log files currently being tracked.
//
const trackedFiles = {};

//
// This function is called when a line of output is received
// from any container on the node.
//
function onLogLine(containerName, line) {
    //
    // At this point you should forward your logs to an
    // external log collector.
    // For this simple example we'll just print them
    // directly to the console.
    //

    // The line is a JSON object so parse it
    // first to extract relevant data.
    const data = JSON.parse(line);
    const isError = data.stream === "stderr"; // Is the output an error?
    const level = isError ? "error" : "info";
    console.log(`${containerName}/[${level}] : ${data.log}`);
}

//
// Commence tracking a particular log file.
//
function trackFile(logFilePath) {
    const tail = new tail.Tail(logFilePath);

    // Take note that we are now tracking this file.
    trackedFiles[logFilePath] = tail;

    // Super simple way to extract the container
    // name from the log filename.
    const containerName = logFileName.split("-")[0];

    // Handle new lines of output in the log file.
    tail.on("line", line => onLogLine(containerName, line));

    // Handle any errors that might occur.
    tail.on("error", error => console.error(`ERROR: ${error}`));
}

//
// Identify log files to be tracked and start tracking them.
//
async function trackFiles() {
    const logFilePaths = await globby(LOG_FILES_GLOB);
    for (const logFilePath of logFilePaths) {
        if (trackedFiles[logFilePaths]) {
            continue; // Already tracking this file, ignore it now.
        }

        // Start tracking this log file we just identified.
        trackFile(logFilePath);
    }
}

async function main() {
    // Start tracking initial log files.
    await trackFiles();

    // Track new log files as they are created.
    chokidar.watch(LOG_FILES_GLOB)
        .on("add", newLogFilePath => trackFile(newLogFilePath));
}

main()
    .then(() => console.log("Online"))
    .catch(err => {
        console.error("Failed to start!");
        console.error(err && err.stack || err);
    });
Listing 3: The simplest Node.js microservice for log aggregation on Kubernetes
The only thing you have to do with listing 3 is decide what to do with your logs. You could, for instance, use HTTP POST requests to send batches of logs to your external log collector.
Listing 4 shows the YAML file to deploy Loggy as a DaemonSet to Kubernetes.
apiVersion: extensions/v1beta1
kind: DaemonSet
metadata:
name: loggy
namespace: kube-system
labels:
    test: loggy
spec:
template:
    metadata:
    labels:
        test: loggy
    spec:
    serviceAccountName: loggy
    containers:
    - name: loggy
        image: <yourcontainerregistry>/loggy:1
        volumeMounts:
        - name: varlog
        mountPath: /var/log
        - name: varlibdockercontainers
        mountPath: /var/lib/docker/containers
        readOnly: true
    volumes:
    - name: varlog
        hostPath:
        path: /var/log
    - name: varlibdockercontainers
        hostPath:
        path: /var/lib/docker/containers
Listing 4: YAML file to deploy Loggy to Kubernetes
The most important thing to see in listing 4 is how the volumes are mapped from the node into the container. The directories /var/log and /var/lib/docker/containers on the node contain the collected logs from all the pods on the node. These directories are mounted into Loggy’s container so that Loggy can access the log files.
Before deploying the DaemonSet in listing 4, you’ll need to set <yourcontainerregistry> to the URL for your own container registry.
You have to build listing 3 into a Docker image, the Dockerfile for it is provided in the example code repository, and push the image to your container registry. Now you can deploy Loggy to your Kubernetes cluster with this command:
kubectl apply -f ./scripts/kubernetes/loggy.yaml
Loggy is now collecting logs from all your microservices. To view the pods that were created run this command:
kubectl --namespace=kube-system get pods
You can pick out each instance of Loggy from the list of system pods (you’ll have one for each node in your cluster). You can then use the logs command to view the aggregated logs for each node (because Loggy is simply outputing to the console). For example:
kubectl --namespace=kube-system logs loggy-7h47q
Just change loggy-7h47q to be one of the instance names that you pick from the output of get pods.
Now you just need to update Loggy to make it send your logs somewhere outside the cluster!
Conclusion
In this blog post we explored the basics of log aggregation on Kubernetes.
We deployed Loggy to the Kubernetes cluster as a DaemonSet. That’s to make it run on every node in our cluster. We mounted the node’s filesystem into Loggy’s container and this gives Loggy access to the log files on that node. From there the logs can be stored in your database or HTTP POSTed to another service.
To complete this system for yourself, you must now augment listing 3 and store your logs in a place where it will be easy for you to view and search them.
Resources
Create your own Kubernetes cluster quickly:
http://www.the-data-wrangler.com/kub-cluster-quick/
You can learn more about building with applications with microservices with my new book Bootstrapping Microservices:
https://www.bootstrapping-microservices.com
Example code for this blog post is available here:
https://github.com/ashleydavis/kubernetes-log-aggregation-example
Here is the documentation for the Kubernetes logging architecture:
https://kubernetes.io/docs/concepts/cluster-administration/logging/
Kubectl cheat sheet:
https://kubernetes.io/docs/reference/kubectl/cheatsheet/