Average true range is an indicator that is useful for judging the volatility of a stock. I use this to set the level for my stop loss orders. In this post I'm going to show how to calculate and visualise average true range in JavaScript.
Contents
Table of Contents generated with DocToc
- Contents
- Getting the code
- Getting the code running
- What is average true range?
- Screenshot
- Computing true range
- Generating ATR with Data-Forge
- Resources
Getting the code
Working example code for this post is available to Patrons.
Please show your support on Patreon and I'll give you access to the code and help you get it running.
Getting the code running
First you'll need NodeJS installed, get the latest version from nodejs.org.
After cloning or downloading and unpacking the code, change to the repo's directory and install dependencies via npm:
cd average-true-range-demo
npm install
Then change into the the client directory and install bower dependencies:
cd client
bower install
To start the server change back to the previous directory and run it using Nodejs:
cd ..
node index
You can now browse to http://localhost:3000 and view the web page.
What is average true range?
Average true range is an indicator that measures the trading range of a stock and shows how volatile it is.
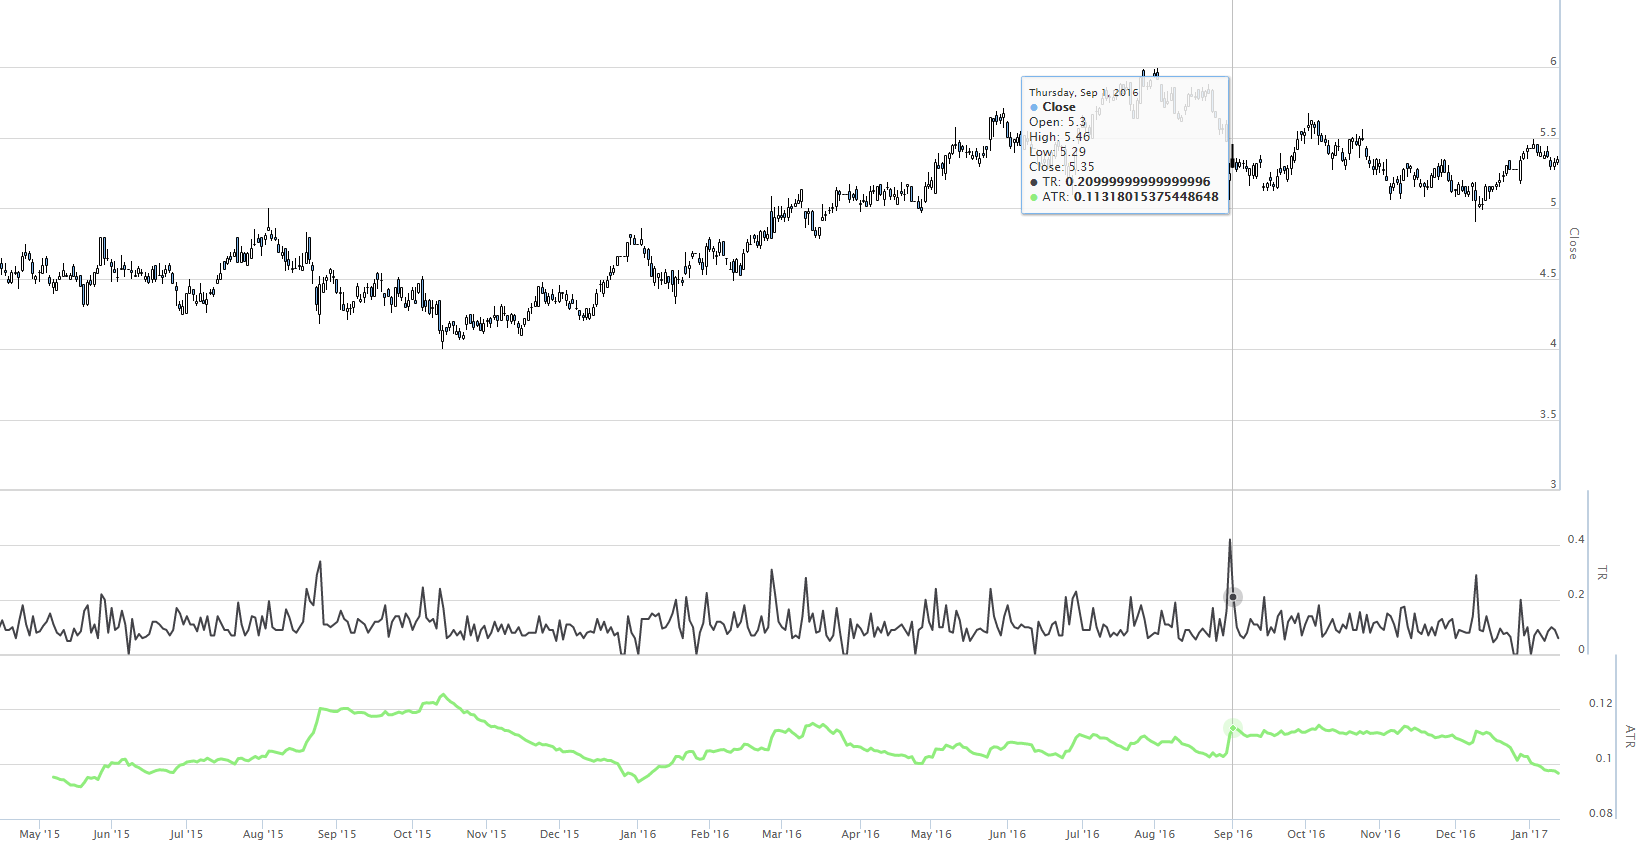
Screenshot
This is what the end result of this post looks like:
Computing true range
Average true range first requires that we compute true range for a stock.
True range is the maximum of the values evaluated from the following formulas:
High - Low
High - Yesterday's Close
Yesterday's Close - Low
The data we need for this is today's high and low and yesterday's close for the stock we are interested in.
We can represent this in JavaScript as follows:
var high = ...
var low = ...
var yesterdaysClose = ...
var trueRange = Math.max(
    high - low,
    high - yesterdaysClose,
    yesterdaysClose - low
);
Generating ATR with Data-Forge
To generate average true range for a stock we must calculate true range over the stock history. Then we can average this value over time.
In this example data is acquired from Yahoo and downloaded to a Data-Forge dataframe as demonstrated in my previous post.
The rollingWindow method is used to walk across the dataframe looking at two days at a time, yesterday and today, to compute a true range time series:
var ohlc = ... dataframe downloaded from yahoo ...

// Compute time series for true range...
var trueRange = ohlc
    .rollingWindow(2)
    .asPairs()
    .select(function (window) {
        var today = window.last()[1];
        var yesterday = window.first()[1];
        var trueRange = Math.max(
            today.High - today.Low,
            today.High - yesterday.Close,
            yesterday.Close - today.Low
        );
        return [
            window.last()[0],
            trueRange,
        ];
    })
    .asValues();
asPairs is used to extract the sequence as index/value pairs, so that we can rewrite the index of the time series. asValues finally brings it back to a sequence of values.
Once we have the true range as a time series, we can use the ema function from data-forge-indicators to compute an exponential moving average:
var averageTrueRange = trueRange.ema(atrPeriod);
It isn't difficult then to visualize this in graph using Highstock, I did something very similar in the previous post.
The time series is converted to Highstock format using data-forge-to-highstock as follows:
var highstockData = averageTrueRange.toHighstock()Resources
Data-Forge: https://www.npmjs.com/package/data-forge
Highstock Demos: http://www.highcharts.com/stock/demo